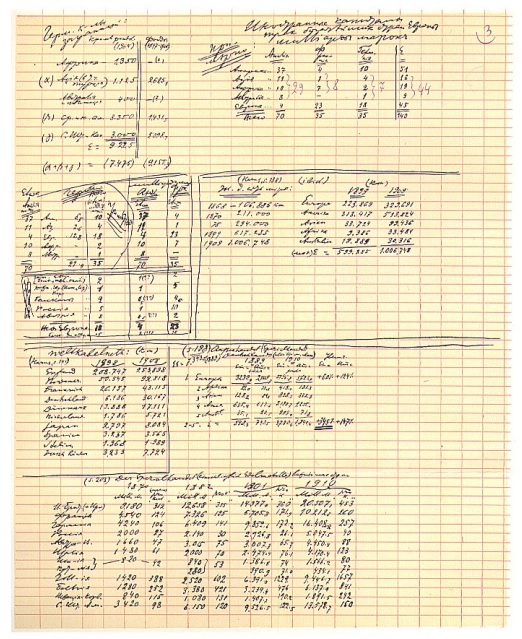
Page 3 of Notebook “ζ” (“Zeta”)
Bernhard Harms, Problems of World Economy, Jena, 1912. “National Economy and World Economy.”
British capital invested abroad (1911) according to G. Paish ((George Paish in the Journal of the Royal Statistical Society, Vol. LXXIV, 1910-11, p. 167)) (“Great Britain’s Capital Investments in the Colonies, etc.”).
(B. Harms, p. 228):
| I. British colonies (£thousands) | ||
| North America | Canada and Newfoundland | 372,541 |
| Australia | Commonwealth of Australia | 301,521 |
| New Zealand | 78,529 | |
| Africa | South | 351,368 |
| West | 29,498 | |
| Asia | India and Ceylon | 365,399 |
| Straits Settlements | 22,037 | |
| Hong Kong | 3,104 | |
| British North Borneo | 5,131 | |
| Other British possessions | 25,024 | |
| Σ = | British colonies | 1,554,152 |
| II. | Foreign countries: |
| United States | 688,078 |
| Cuba | 22,700 | ||||
| Philippines | 8,202 |
| Argentina | 269,808 | ||||
| Mexico | 87,334 | ||||
| Brazil | 94,330 | ||||
| Chile | 46,375 | ||||
| Uruguay | 35,255 | ||||
| Peru | 31,986 | ||||
| Other American countries | 22,517 | ||||
| Russia | 38,388 | |
| Turkey | 18,320 | |
| Egypt | 43,753 | |
| Spain | 18,808 | |
| Italy | 11,513 | |
| Portugal | 8,134 | |
| France | 7,071 | |
| Germany | 6,061 | |
| Other European countries | 36,319 | |
| Japan | 53,705 | |
| China | 26,809 | |
| Other foreign countries | 61,907 | |
| Σ = foreign countries | 1,637,684 | [1] |
| ΣΣ = Total | 3,191,836 |
| (In all, he says, £3½ thousand million) | ||||
| Same, by continents (£ million) | ||||
| Per cent | ||||
| America | 1,700 = 53 | |||
| Asia | 500 | 16 | ||
| Africa | 455 | 14 | ||
| Australia | 387 | 12 | ||
| Europe | 150 | 5 | ||
| 3,192 | 100% | |||
Dr. Sigmund Schilder, Development Trends in the World Economy, Berlin, 1912—p. 150—refers to G. Paish, whose figures, he says, are minimised, for Paish takes issue prices (for Latin America 556 = £ 556 million, whereas London Stock Exchange quotations on May 31, 1909 Σ = £767 million, including Argentina—£281 million, Brazil—£140 million).—
The London Economist, August 26, 1911, estimates British capital in 10 South American republics (Argentina, Brazil, Uruguay, Chile, Peru, Bolivia, Colombia, Venezuela, Ecuador and Paraguay) at £ 622 million, including Argentina—316, Brazil—162, Uruguay—42, Chile—41 (ibidem, p. 371).
Foreign capital in Canada (1910) = 12,687 million francs, including British—9,765, U.S.—2,190, French—372. In Mexico (1886-1907) =3,343 million francs, including U.S.—1,771, British—1,334 (p. 373).
Belgian capital abroad (Berlin Export, November 24, 1910) in million francs: Holland—70; France—137; Brazil—143; Italy—166; Egypt—219; Germany—244; Argentina—290; the Congo—322; Spain—337; Russia—441; other countries—338. Total—2,750 million francs (p. 365).
| French capital abroad | ||
| (ibidem, p. 235) | Thousand mill. francs |
|
| Russia | 10.0 | |
| Great Britain | 0.5 | |
| Belgium and Holland | 0.5 | |
| Germany | 0.5 | |
| Turkey, Serbia and Bulgaria | 0.5 | |
| Rumania and Greece | 4.0 | |
| Austria-Hungary | 2.0 | |
| Italy | 1.5 | |
| Switzerland | 0.5 | |
| Spain and Portugal | 3.5 | |
| Canada and United States | 1.0 | |
| Egypt and Suez | 4.0 | |
| Argentina, Brazil and Mexico | 3.0 | |
| China and Japan | 1.0 | |
| Tunisia and French colonies | 3.0 | |
| Σ=35.5 | [2] | |
| Total now estimated at 40,000-42,000 million. | ||
| German capital abroad (1904) exclusive of securities (non-European areas) (million marks) |
|||
| Turkey (without Egypt) | 350 | ||
| Africa (including Egypt) | 1,350 | ||
| Persian-Arabian Peninsula and India | 75 | ||
| South-East Asia | 250 | ||
| East Asia | 450 | ||
| Australia and Polynesia | 400 | ||
| Caribbean countries | 1,200 | ||
| West coast of South America | 550 | ||
| East ” ” ” ” | 1,600 | ||
| United States and Canada | 3,000 | ||
| Σ = 9,225 | |||
| German capital abroad (securities) (1897-1906) | |||
| also million marks |
|||
| Argentina | 92.1 | ||
| Belgium | 2.4 | ||
| Bosnia | 85.0 | ||
| Brazil | 77.6 | ||
| Bulgaria | 114.3 | ||
| Chile | 75.8 | ||
| Denmark | 595.4 | ||
| China | 356.6 | ||
| Finland | 46.1 | ||
| Great Britain | 7.6 | ||
| Italy | 141.9 | ||
| Japan | 1,290.4 | ||
| Canada | 152.9 | ||
| Cuba | 147.0 | ||
| Luxemburg | 32.0 | ||
| Mexico | 1,039.0 | ||
| Netherlands | 81.9 | ||
| Norway | 60.3 | ||
| Austria | 4,021.6 | ||
| Portugal | 700.7 | ||
| Rumania | 948.9 | ||
| Russia | 3,453.9 | ||
| Serbia | 152.0 | ||
| Sweden | 355.3 | ||
| Switzerland | 437.6 | ||
| Spain | 11.2 | ||
| Turkey | 978.1 | ||
| Hungary | 1,506.3 | ||
| United States of America | 4,945.8 | ||
| (My total) | Σ = 921,909.7 | ||
Author estimates total German capital abroad at 35,000 million marks (p. 243).
|
⎧ ⎨ ⎩ |
The (1904) figure=9,225 plus, he reckons, the same |
⎫ ⎬ ⎭ |
|||
| amount in Europe | Σ | = 18,000 | |||
| Further, securities totalling about | 17,000 | ||||
| Σ | = 35,000 | [3] | |||
| America | 6,530.2 | |
| Asia (Turkey) | 2,625.1 | |
| Africa | — | |
| Australia | — | |
| Europe | 12,754.4 | |
| Σ = | 21,909.7 |
| N.B. |
On the question of German capital investments abroad, B. Harms quotes (besides Sartorius): Ries- ser, German Big Banks and Their Concentra- tion, 3rd edition, Jena, 1910.—Paul Dehn, New Developments in World Economy, Berlin, 1904.— Paul Arndt, “The Nature and Purpose of Capital Investment Abroad”, Zeitschrift für Sozial- wissenschaft, 1912, (No. 1-3).— Robert Liefmann, Holding and Financing Companies, Jena, 1909.— |
|||
| N.B. |
| German capital abroad: | ||||||
| Exclusive of securities (1904) |
Securities (1897-1906) |
|||||
| Africa | 1,350 | —(?) | ||||
| (α) | Asia (including Turkey) | 1,125 | 2,625.1 | |||
| Australia and Polynesia | 400 | —(?) | ||||
| (β) | Central and South America | 3,350 | 1,431.5 | |||
| (γ) | U.S.A. and Canada | 3,000 | 5,098.7 | |||
| Σ = 9,225 | ||||||
| (α+β+γ)=(7,475) | (9,155.3) | |||||
Foreign capital of the three richest European countries, approximately[4]:
| (thousand million marks) | ||||||||||
| Great Britain | France | Germany | Σ | |||||||
| America | 37 | 4 | 10 | 51 | ||||||
| Asia | 11 | 1 | 4 | 16 | ||||||
| Africa | 10 | 29 | 7 | 8 | 2 | 7 | 19 | 44 | ||
| Australia | 8 | — | 1 | 9 | ||||||
| Europe | 4 | 23 | 18 | 45 | ||||||
| Total | 70 | 35 | 35 | 140 | ||||||
| Approx. Great Britain |
Germany | ||||||||||||
| thousand mill. marks | |||||||||||||
| Total approx. (thousand mill. marks) |
Great Britain |
France | |||||||||||
| approx |
approx | ||||||||||||
| 37 | America | 6.5 | 10 | 37 | 4 | ||||||||
| 11 | Asia | 2.6 | 4 | 11 | 1 | ||||||||
| 4 | Europe | 12.8 | 18 | 4 | 23 | ||||||||
| 10 | Africa | — | 2 | 10 | 7 | ||||||||
| 8 | Australia | — | 1 | 8 | — | ||||||||
| 70 | 21.9 | 35 | 70 | 35 | |||||||||
| Western Europe (Belgium, Switzerland, Scandinavian countries) |
2 | 1(??) | 2 | ||||||||||
| South Europe (Spain, Italy, Portugal) |
1 | 1 | 5 | ||||||||||
| Balkans | 2 | 0.5 | (??) | 4 | |||||||||
| Russia | 5 | 1 | 10 | ||||||||||
| Austria | 8 | 0.5 | (??) | 2 | |||||||||
| All Europe | 18 | 4 | 23 | ||||||||||
| Balkans + Russia + Austria | 15 | 2(??) | 16 | ||||||||||
| World railways (Harms, p. 138) (ibidem): |
||
| 1868 | 106,886 | km |
| 1870 | 211,000 | |
| 1875 | 294,000 | |
| 1899 | 617,285 | |
| 1909 | 1,006,748 | |
| (km.) | |||||||
| 1899 | 1909 | ||||||
| Europe | 223,869 | 329,691 | |||||
| America | 313,417 | 513,824 | |||||
| Asia | 33,724 | 99,436 | |||||
| Africa | 9,386 | 33,481 | |||||
| Australia | 18,889 | 30,316 | |||||
| (my) Σ=599,285 | 1,006,748 | ||||||
| World telegraph lines (km.) (Harms, p. 141): | |||||||
| 1899 | 1909 | ||||||
| Great Britain | 208,747 | 253,898 | |||||
| North America | 50,545 | 92,818 | |||||
| France | 26,157 | 43,115 | |||||
| Germany | 6,186 | 30,167 | |||||
| Denmark | 13,888 | 17,111 | |||||
| Netherlands | 1,786 | 5,721 | |||||
| Japan | 2,797 | 8,084 | |||||
| Spain | 3,237 | 3,565 | |||||
| Italy | 1,968 | 1,989 | |||||
| Miscellaneous countries | 3,233 | 7,724 | |||||
| Foreign trade (special trade) of Germany (p.198) |
|||||||||
| (million marks) | |||||||||
| 1899 | 1909 | Increase | |||||||
| Import | Export | Import | Export | Import | Export | ||||
| 1. Europe | 3,239.9 | 2,509.7 | 5,196.8 | 5,623.9 | +60% | +124% | |||
| 2. Africa | 39.6 | 22.1 | 418.0 | 181.3 | |||||
| 3. Asia | 128.2 | 84.3 | 828.3 | 332.3 | |||||
| 4. America | 635.4 | 613.6 | 2,190.7 | 1,255.0 | |||||
| 5. Australasia | 35.1 | 23.5 | 293.0 | 71.8 | |||||
| 2-5. Σ= | 838.3 | 743.5 | 3,730.0 | 1,840.4 | +345% | +147% | |||
| ΣΣ= | 7,343.5 (1889) | ||||||||
| (p. 203) Special trade (including noble metals) of the most important countries | ||||||||||||||||
| 1870 | 1882 | 1901 | 1910 | |||||||||||||
| million marks |
(marks) per head |
million marks |
per head |
million marks |
per head |
million marks |
per head |
|||||||||
| Great Britain (+Ireland) |
9,180 | 312 | 12,658 | 355 | 14,977.0 | 360 | 20,570.1 | 453 | ||||||||
| France | 4,540 | 124 | 7,326 | 195 | 6,705.8 | 171.9 | 10,212.5 | 260 | ||||||||
| Germany | 4,240 | 106 | 6,409 | 141 | 9,852.6 | 172.2 | 16,408.8 | 257 | ||||||||
| Russia | 2,000 | 27 | 2,140 | 30 | 2,926.8 | 26.1 | 5,047.5 | 40 | ||||||||
| Austria-Hungary | 1,660 | 47 | 3,015 | 75 | 3,007.3 | 65.7 | 4,450.4 | 88 | ||||||||
| Italy | 1,480 | 61 | 2,000 | 70 | 2,474.4 | 76.1 | 4,170.4 | 123 | ||||||||
| Spain | } | 820 | 42 | 840 | } | 53 | 1,386.8 | 74 | 1,566.2 | 80 | ||||||
| Portugal | 280 | 390.9 | 71.0 | 434.1 | 77 | |||||||||||
| Holland | 1,420 | 388 | 2,520 | 602 | 6,391.0 | 1,229 | 9,446.7 | 1,657 | ||||||||
| Belgium | 1,280 | 252 | 3,380 | 421 | 3,239.4 | 476 | 6,137.9 | 841 | ||||||||
| Sweden-Norway | 840 | 115 | 1,080 | 131 | 1,407.7 | 190.2 | 1,891.5 | 242 | ||||||||
| United States of America |
3,420 | 98 | 6,150 | 120 | 9,526.5 | 122.5 | 13,578.7 | 150 | ||||||||
[1] So given by Harms.—Ed.
[2] See present edition. Vol. 22, pp. 242-43.—Ed.
[3] See present edition, Vol. 22, p. 243.—Ed.
[4] Ibid., p. 243.—Ed.
| | |
| | | | | | | ||||||